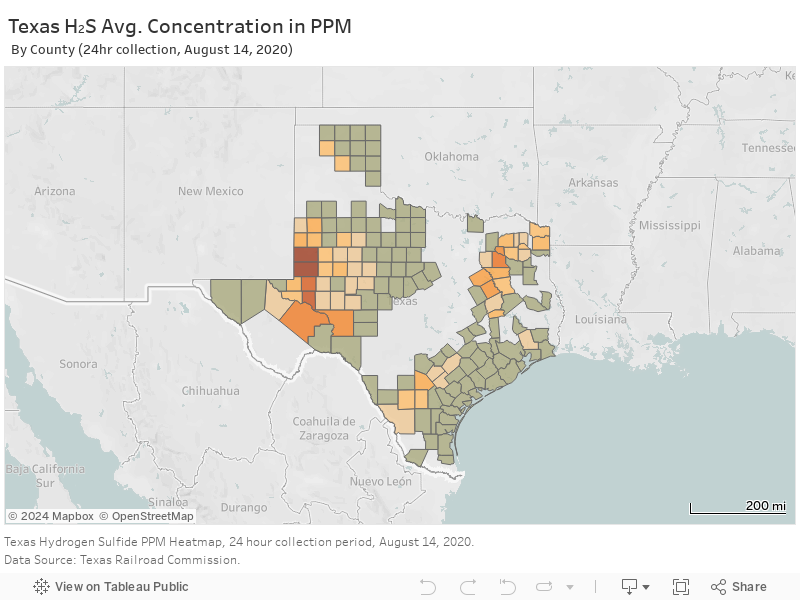
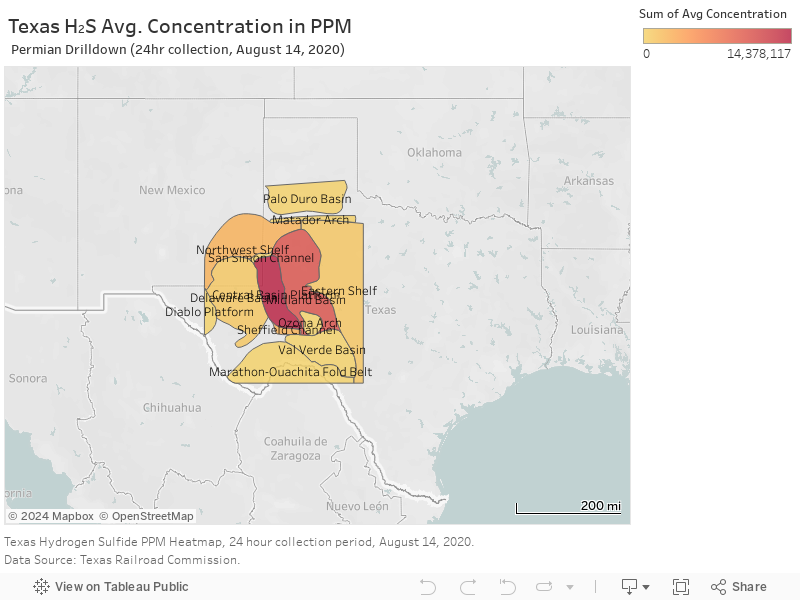
H₂S emissions in Texas | Custom GIS overlay | Permian sub-basin example
This project is another example of mapping inside of Tableau. A friend came to me wanting to investigate Hydrogen Sulfide emissions in West Texas. The source data is a public dataset from the Texas Railroad Commission. Hydrogen Sulfide is a byproduct of oil & natural gas production that must be treated at an appropriate facility. As one would expect, the Permian Basin has the highest concentration of H₂S associated with higher activity levels. The second visual shows a custom overlay of the Permian sub-basins and the given levels of H₂S concentration. With this sort of information Companies can better understand activity levels, plan developments, and monitor emissions. Government agencies can conduct site audits, plan environmental projects, and develop a better understanding of this particular metric of energy production emissions.